Unified entry point for Fisher's-Exact-Test enrichment visualizations.
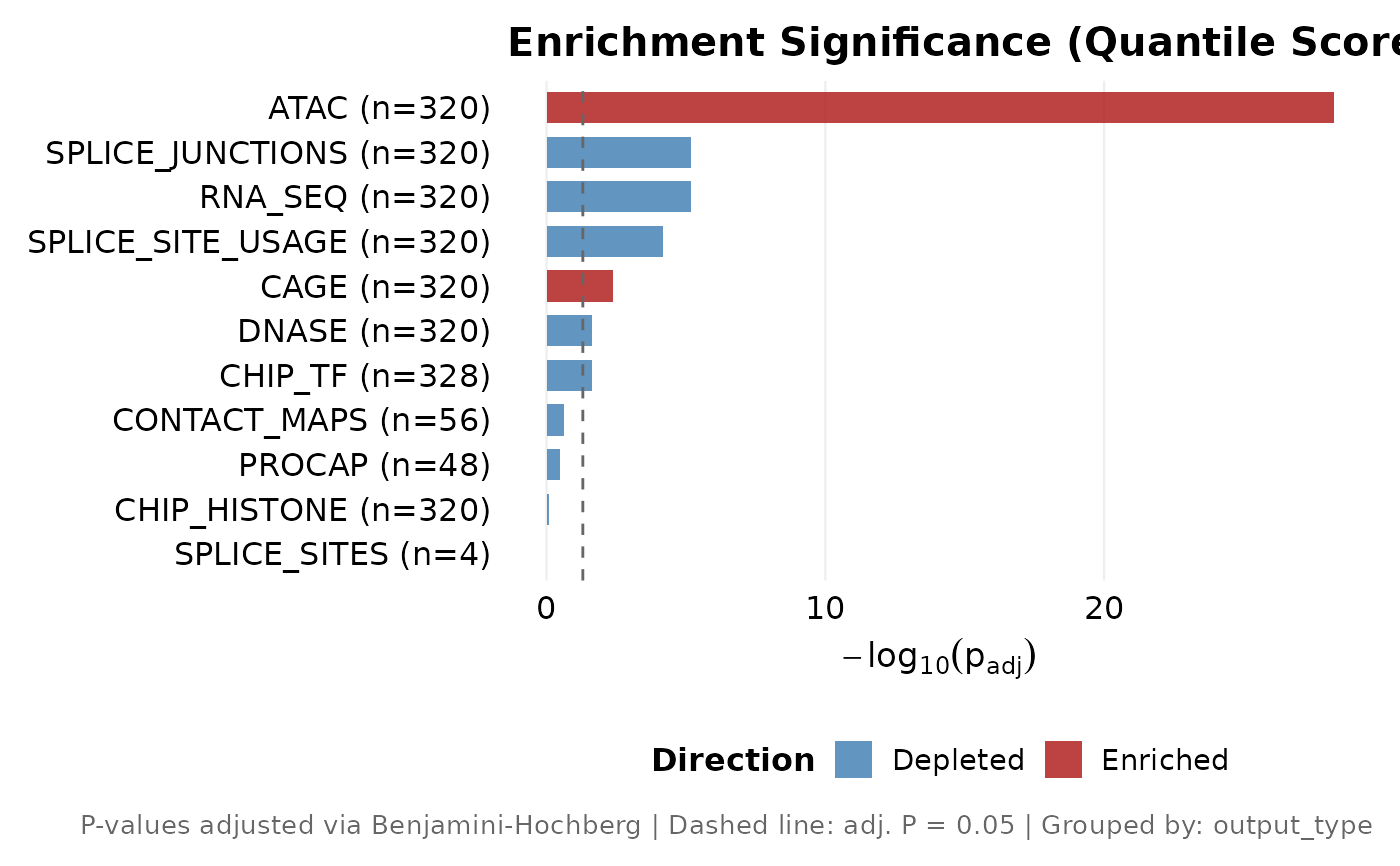
style = "bar" ranks groups by significance, "volcano" plots
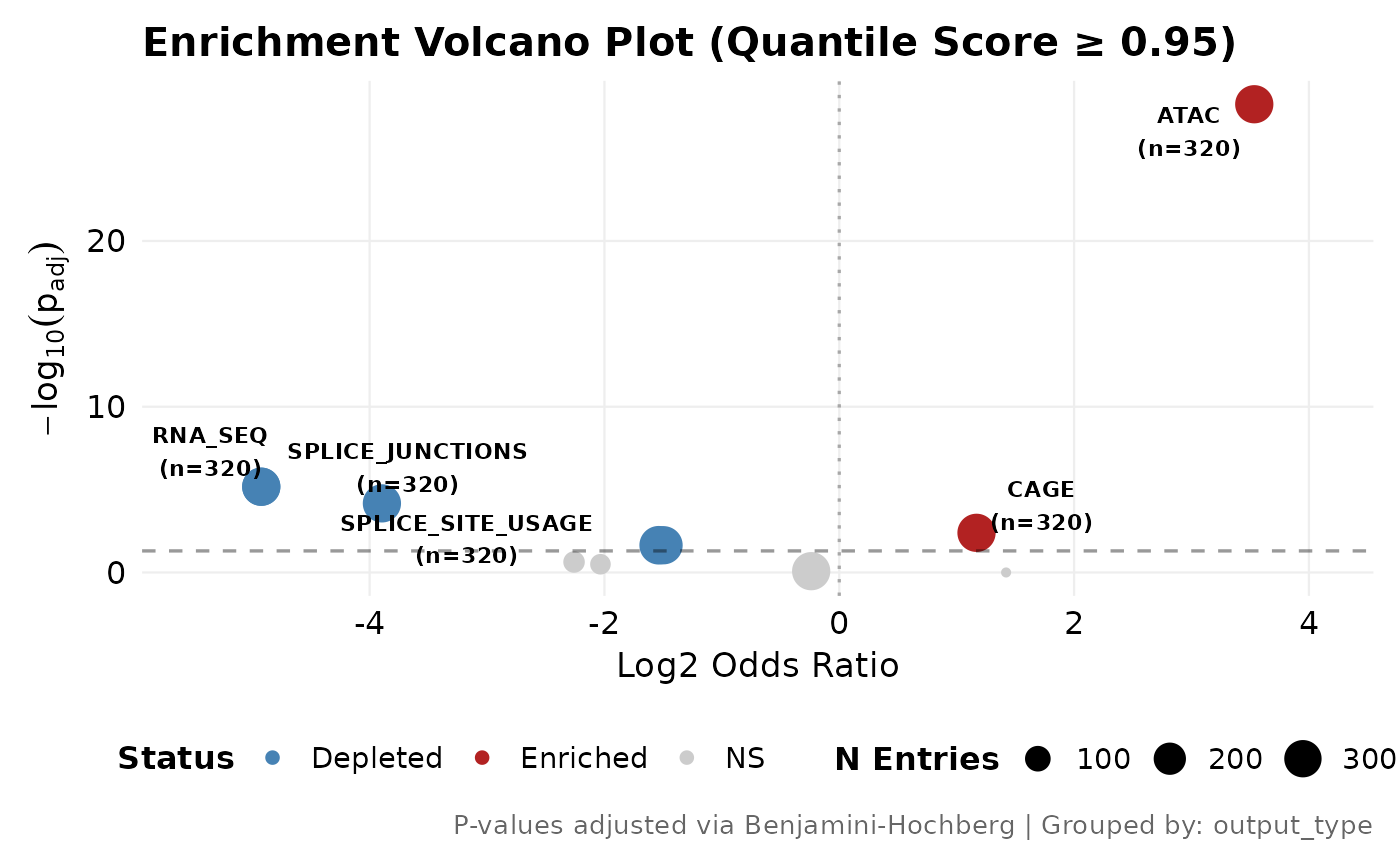
effect size (Log2 OR) against significance, and "threshold_scan"
sweeps the hit/non-hit quantile cutoff and plots the log2(OR) trajectory per
group. The "bar" and "volcano" styles read the stored
enrichment and require av_calc_enrichment to have been run;
"threshold_scan" runs its own enrichment sweep with
return_only = TRUE and does not mutate obj$stats.
Arguments
- obj
An
AlphaVarSetobject.- style
One of
"bar","volcano","threshold_scan".- group_by
Grouping column for the
"threshold_scan"sweep (default"output_type").- fdr_threshold
Adjusted-P cutoff for
"bar"/"volcano"significance (default0.05).- top_n
Maximum number of groups for the
"bar"style (default20).- label_top_n
Number of points to label in the
"volcano"(default15).- highlight
Character vector of group names to ring and label in the
"volcano"(optional).- highlight_color
Colour of the volcano highlight ring (default
"#FF6600").- thresholds
Numeric vector of quantile thresholds for the
"threshold_scan"sweep (defaultseq(0.5, 0.95, 0.05)).- scan_top_n
Integer or
NULL. For"threshold_scan", keep only thescan_top_ngroups with the largestmax(abs(log2OR)).- key
Slot in
obj$stats$comparisonsthe"bar"and"volcano"styles read (default"enrichment"). Must match thekeypassed toav_calc_enrichment. Ignored by"threshold_scan", which computes its own sweep.
Interpretation
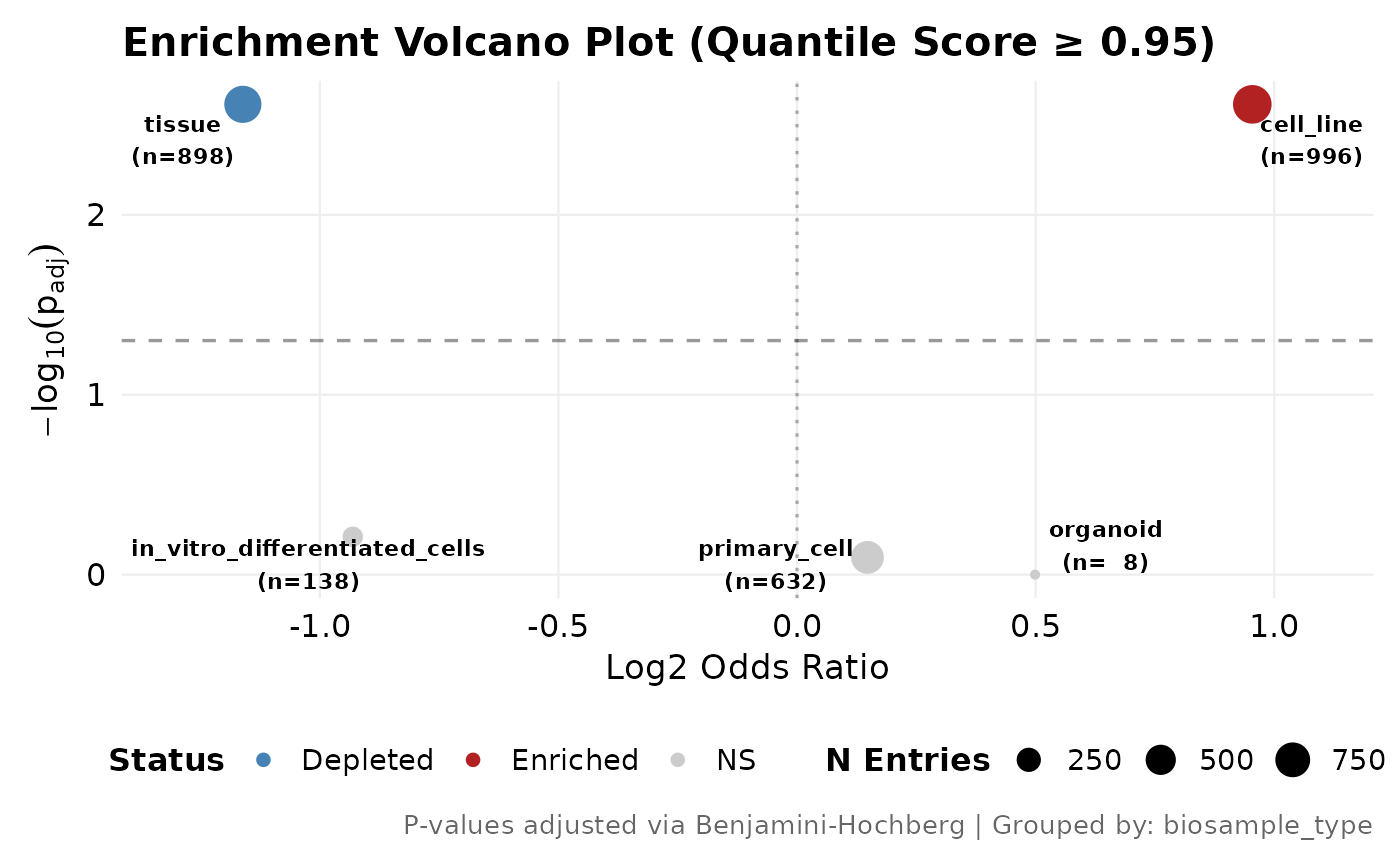
Bars/points beyond the significance line are enriched or depleted (red = more high-scoring variants than expected, blue = fewer). In the volcano, large points have more statistical power; labelled points are the top hits. In the threshold scan, flat trajectories indicate threshold-robust enrichment, while steeply rising or falling curves mean the signal depends on where the cutoff is placed.
Examples
example_file <- system.file("extdata", "bcl11a_rs1427407_example.csv", package = "AlphaVaR")
obj <- av_import_csv(example_file)
#> Reading bcl11a_rs1427407_example.csv ...
obj <- av_calc_enrichment(obj)
av_plot_enrichment(obj, style = "bar")
 av_plot_enrichment(obj, style = "volcano", label_top_n = 5)
#> Fewer than 15 enrichment groups. Consider style = "bar" for small group counts.
av_plot_enrichment(obj, style = "volcano", label_top_n = 5)
#> Fewer than 15 enrichment groups. Consider style = "bar" for small group counts.
 # A second enrichment lives under its own key and is plotted through it.
obj <- av_calc_enrichment(obj, group_by = "biosample_type",
key = "enrichment_by_biosample_type")
#> Warning: Dropped 4 of 2676 rows with NA in 'biosample_type' or 'quantile_score'.
av_plot_enrichment(obj, style = "volcano",
key = "enrichment_by_biosample_type")
#> Fewer than 15 enrichment groups. Consider style = "bar" for small group counts.
# A second enrichment lives under its own key and is plotted through it.
obj <- av_calc_enrichment(obj, group_by = "biosample_type",
key = "enrichment_by_biosample_type")
#> Warning: Dropped 4 of 2676 rows with NA in 'biosample_type' or 'quantile_score'.
av_plot_enrichment(obj, style = "volcano",
key = "enrichment_by_biosample_type")
#> Fewer than 15 enrichment groups. Consider style = "bar" for small group counts.