AlphaVaR is a statistical framework for variant effect scores from AlphaGenome. It turns raw deep learning output into testable regulatory hypotheses.
The package covers the full workflow from raw scores to biological answers: import and overview, exploratory scoping, a statistical engine in which each function answers one clearly formulated question, and outputs (plots, an HTML/PDF report, an interactive Shiny app).
Workflow Overview
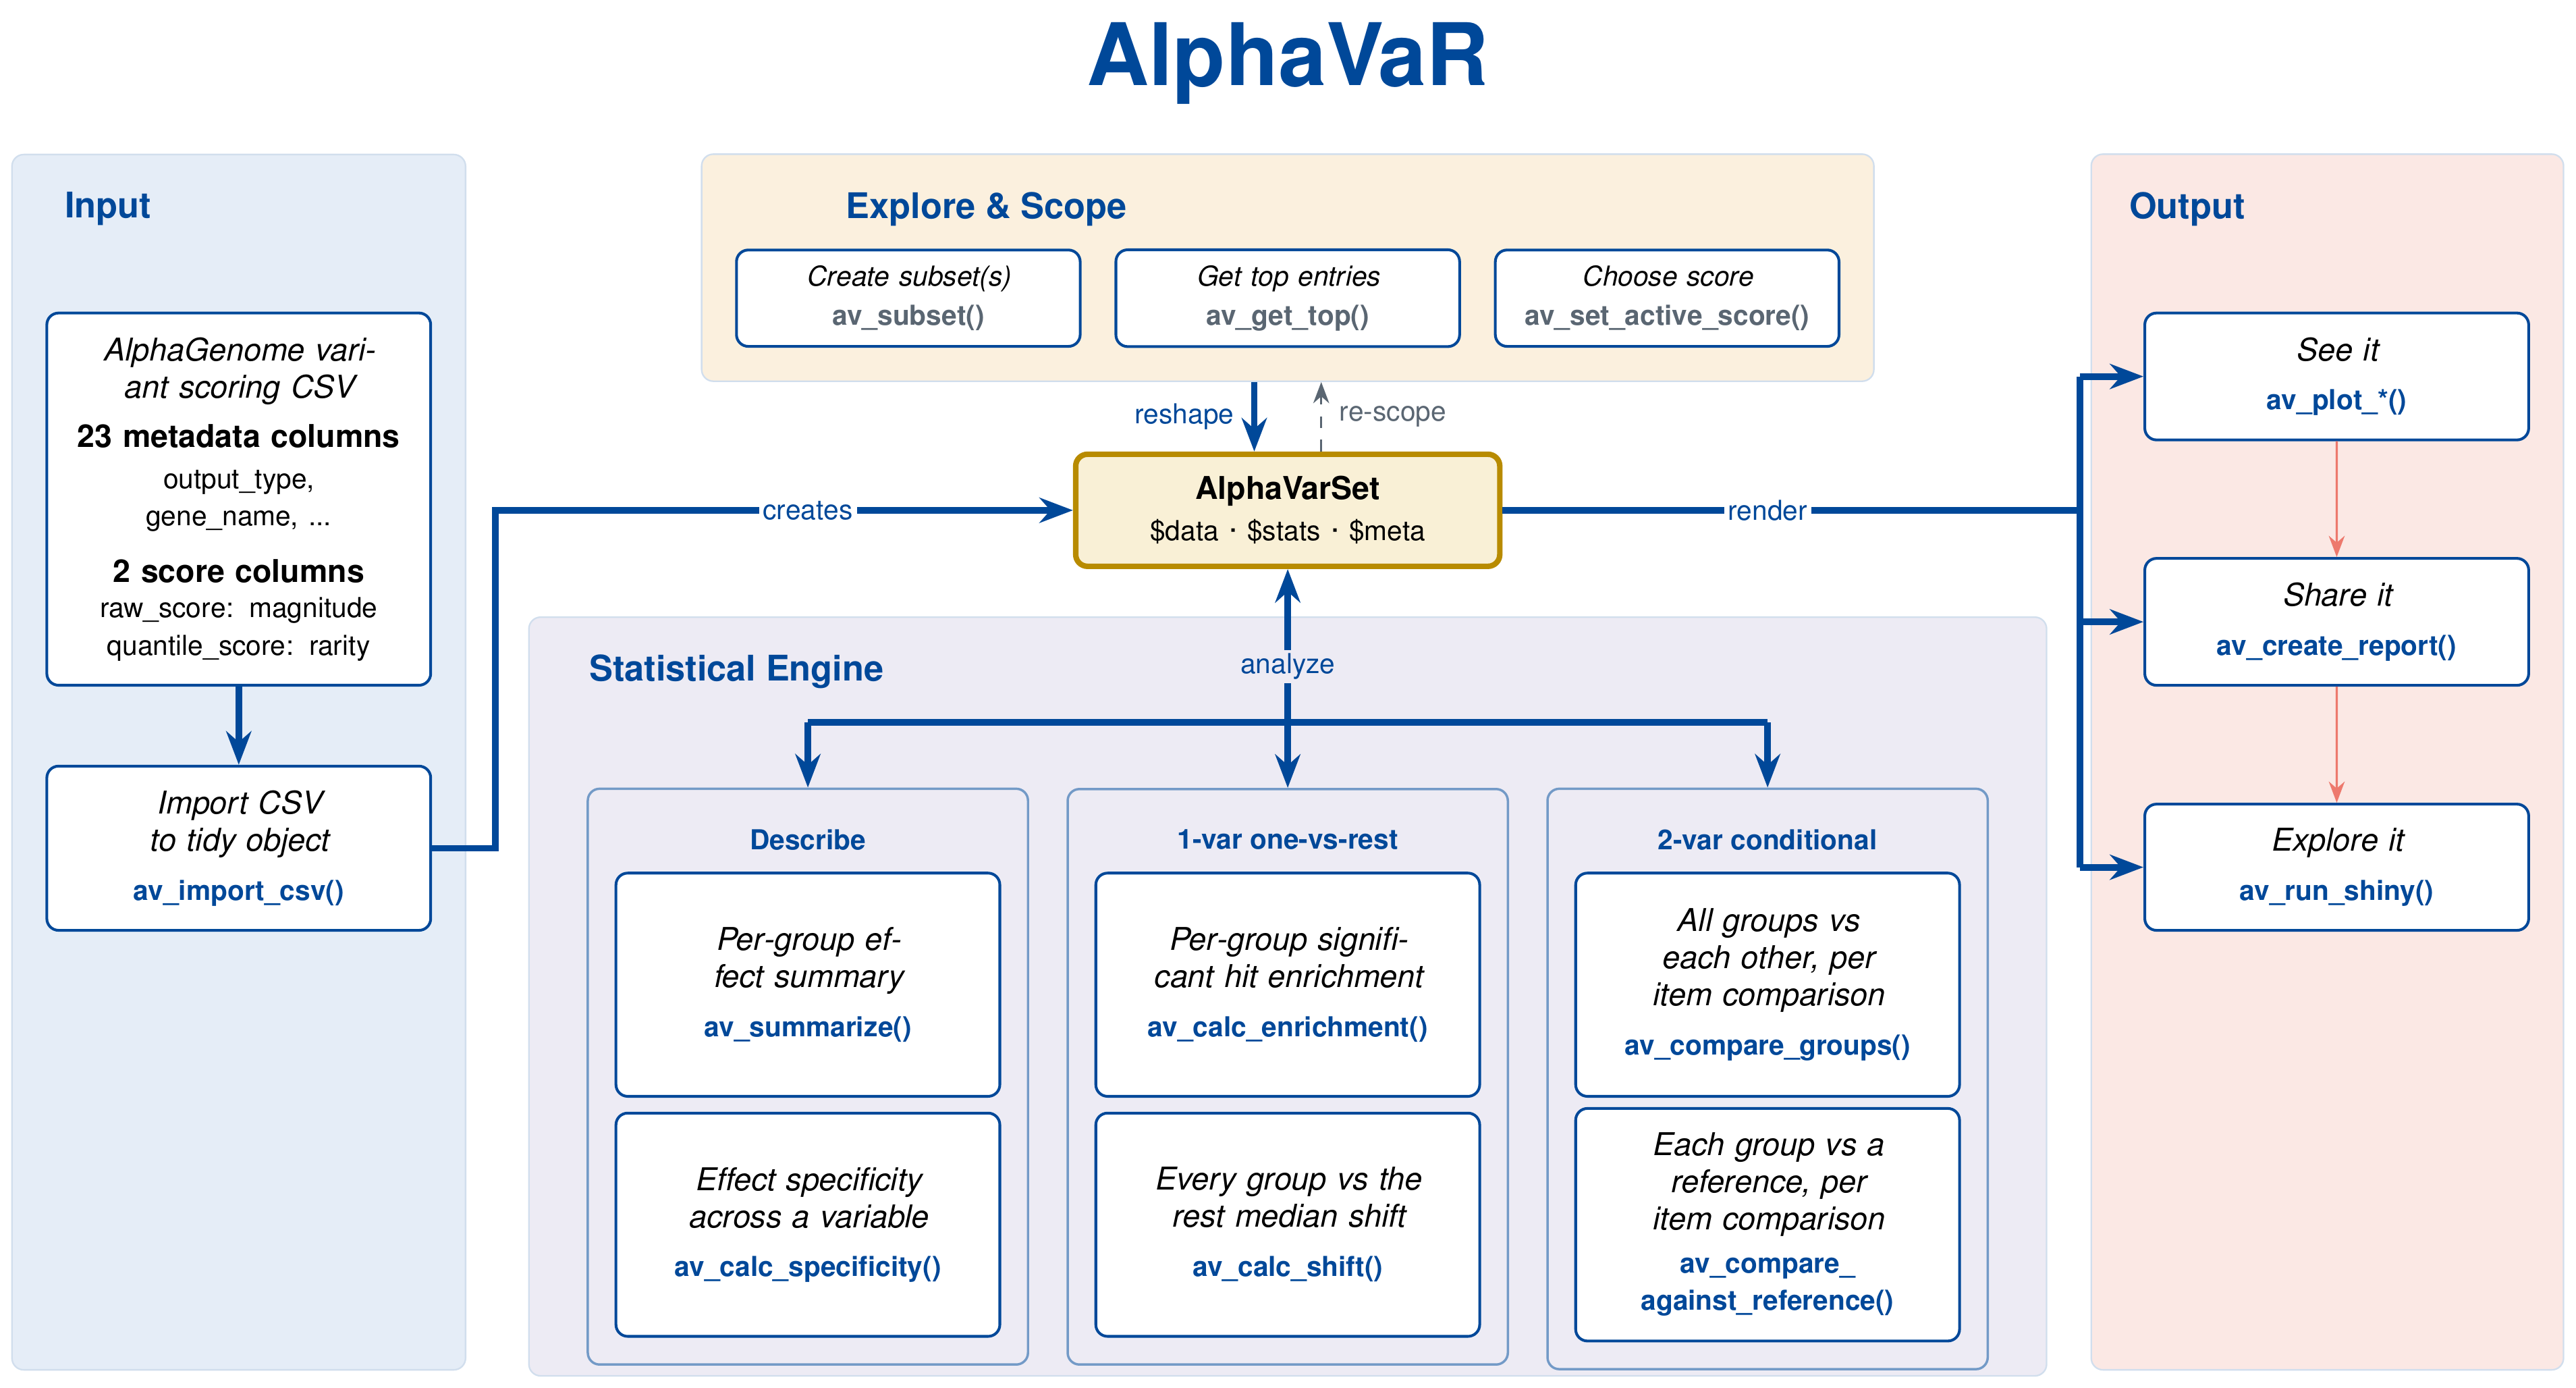
The figure is built around the central AlphaVarSet object:
-
Input. An AlphaGenome export is a table of 25 columns: 23 metadata columns (variant, locus, modality, tissue, transcription factor, histone mark, gene, …) plus 2 effect scores (
raw_scorefor magnitude and direction,quantile_scorefor statistical rarity). -
Ingest and overview.
av_import_csv()turns that table into the centralAlphaVarSetobject;av_overview_summary()/av_overview_breakdown()give a first overview. -
Explore & scope. Data operations (
av_subset(),av_get_top(),av_as_subsets(), …) decide which slice you ask about. They reshape the object and reset cached statistics, so the engine can be re-run on the new scope. -
Statistical engine. Every calculation function answers one general question over a chosen variable: where does the effect stand out? (
av_calc_enrichment(),av_compare_*()), how specific is it? (av_calc_specificity()), which variant should be prioritized? (av_prioritize()). Each card is marked by what it returns: a test (p-value), a descriptor, a set, or a ranking. - Output. Plots, an HTML/PDF report, or the interactive Shiny app render from the object’s current state.
One engine, any variable: the same tests and metrics answer every question, and you pick the per and across variables from the 23 metadata columns. The AlphaVarSet object is the single source of truth: analysis functions read it, write their results back into it, and the outputs render from it.
Installation
AlphaVaR requires R 4.2 or newer and is installed from GitHub. Its Bioconductor dependencies are resolved automatically through the Remotes field of DESCRIPTION, so no separate BiocManager step is needed.
# install.packages("devtools")
devtools::install_github("KarimMarhaba/AlphaVaR", dependencies = TRUE)
Quick Start
The package ships with the complete AlphaGenome output for rs1427407, gzipped: 71,420 scored rows over both alternate alleles, 11 modalities, in the full 25-column schema. This runs as written, without downloading anything:
library(AlphaVaR)

scores <- system.file("extdata", "bcl11a_rs1427407_scores.csv.gz", package = "AlphaVaR")

# 1. Import: an AlphaGenome CSV becomes an AlphaVarSet
obj <- av_import_csv(scores)
obj

# 2. Ask a question: which modalities carry more extreme scores than the rest?
obj <- av_calc_enrichment(obj, group_by = "output_type")
obj$stats$comparisons[["enrichment"]]$fisher_tidy

# 3. Plot and report
av_plot_enrichment(obj, style = "bar")
av_create_report(obj, output_file = "AlphaVaR_report.html")
To explore the same data in the browser instead, one call opens the Shiny app:
av_explore(scores)Documentation
- Rendered reference and articles: https://karimmarhaba.github.io/AlphaVaR/
- The worked example in R:
vignette("AlphaVaR") - Per-function help:
?av_import_csv,?av_calc_specificity,?av_prioritize, … - Reproducing the figures of the application note: Supplementary Section S5 of the paper, built from
paper/supplementary.Rmd