Three views built from the specificity statistics in
obj$stats$specificity[[across]] (see av_calc_specificity),
selected with style:
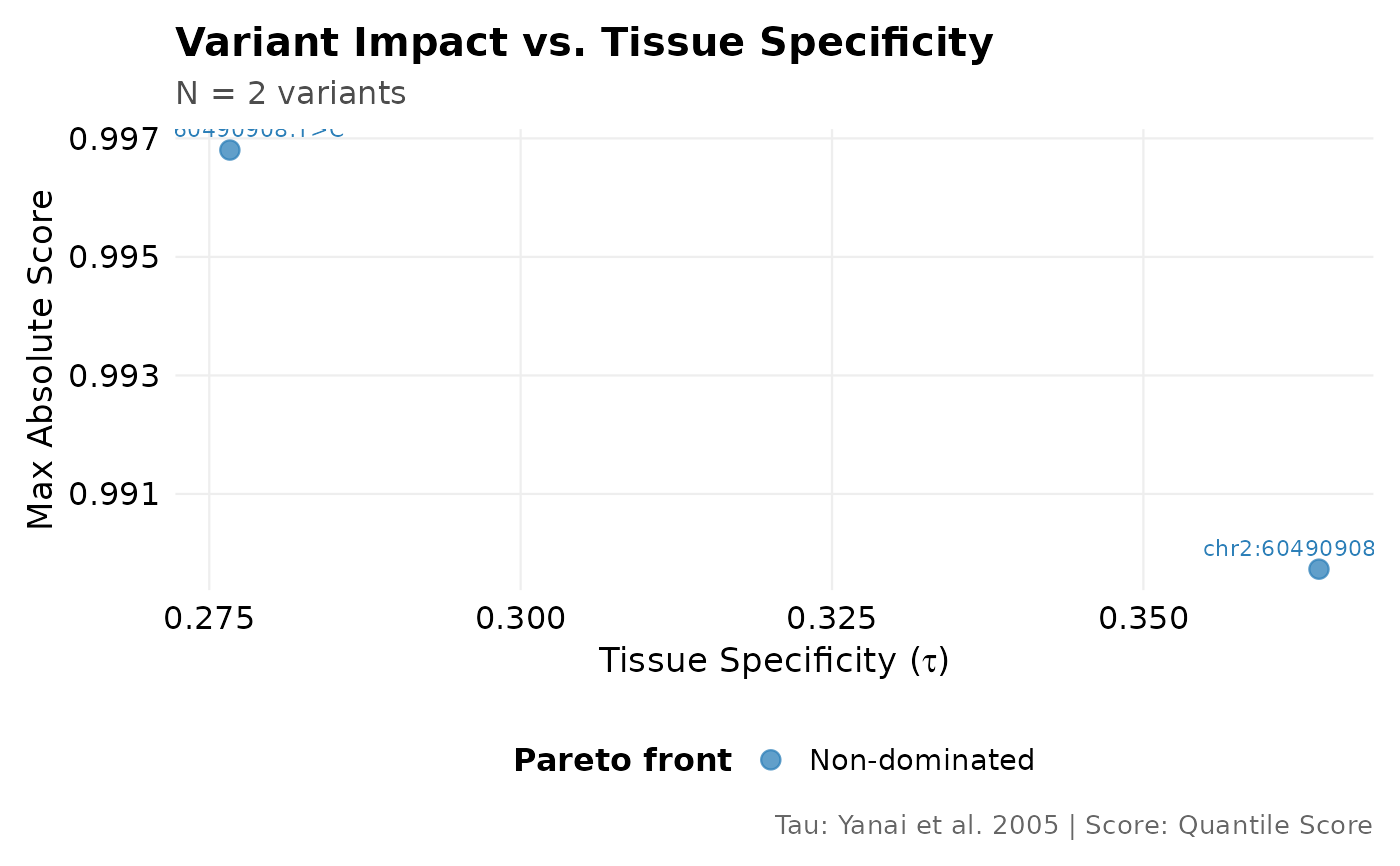
"impact"(default) Scatter of each variant's maximum absolute regulatory impact against its specificity (Tau, Yanai et al. 2005), coloured by Pareto membership. High Tau marks an element-selective effect, low Tau a broad one. Additionally needs the prioritization table (
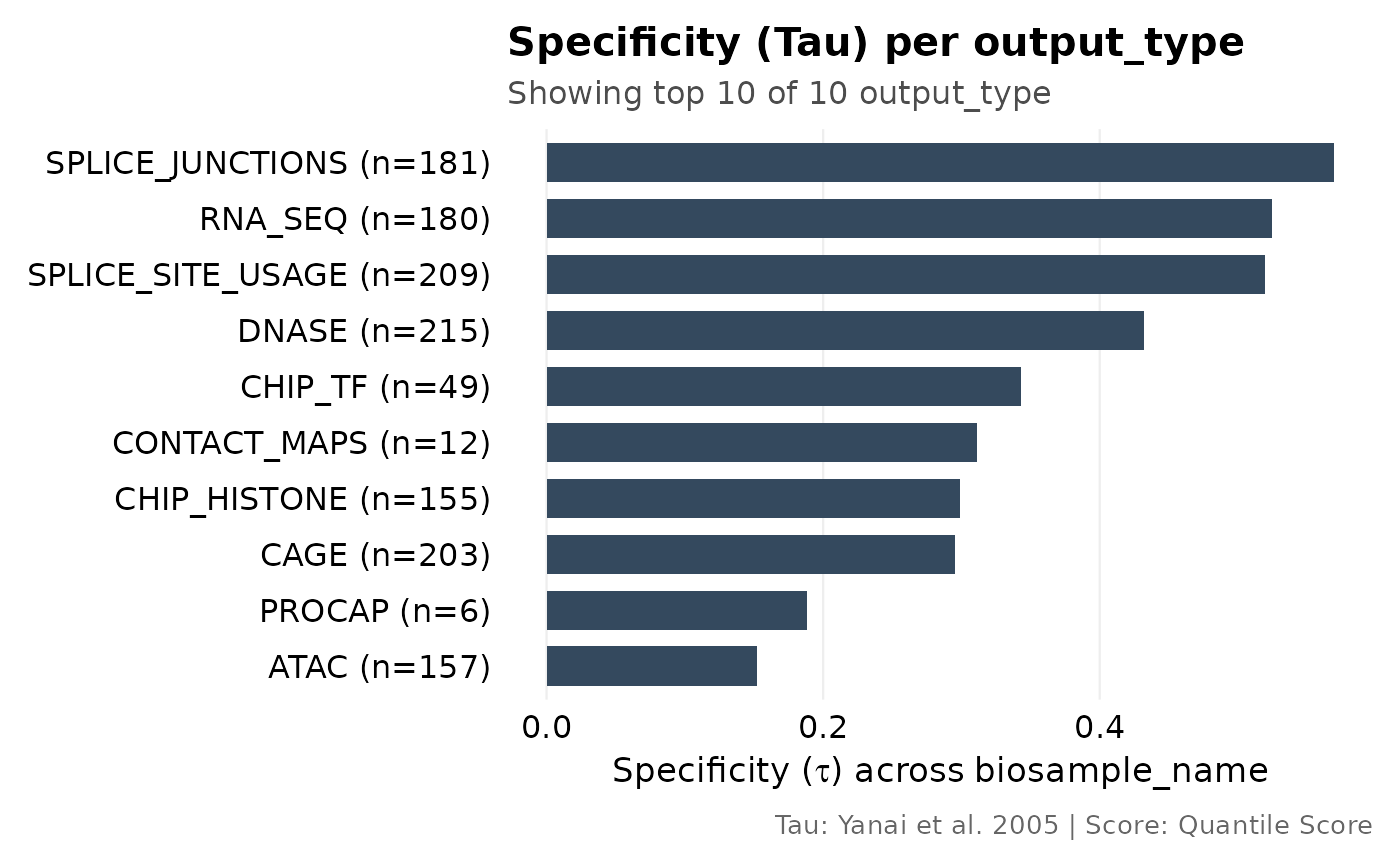
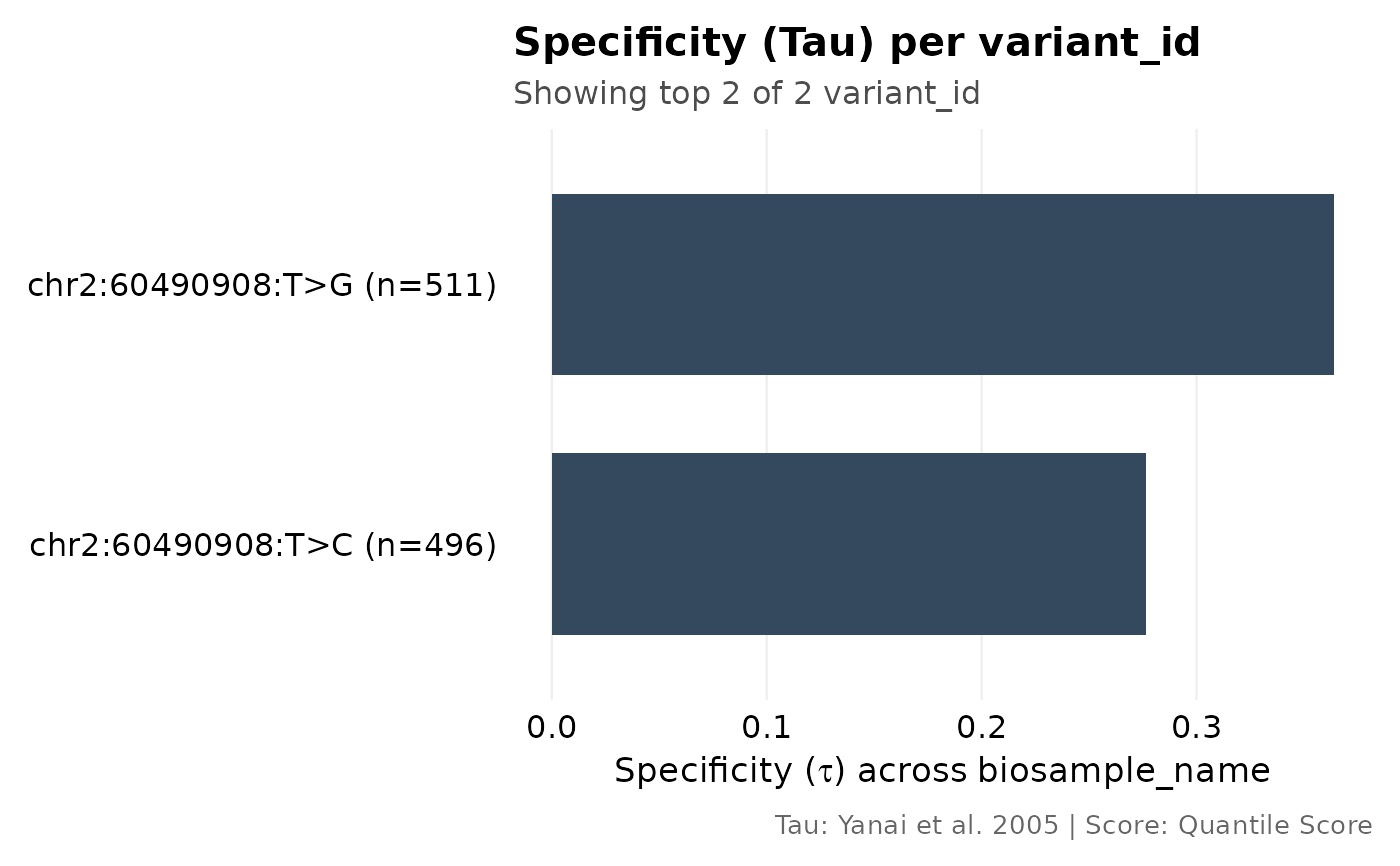
av_prioritize)."tau"Bars of Tau per unit (the
perunit ofav_calc_specificity), sorted. Shows how concentrated each unit is across theacrossvariable. Reads only the specificity slot, so it works for any(per, across)pair."top_element"Frequency of the winning
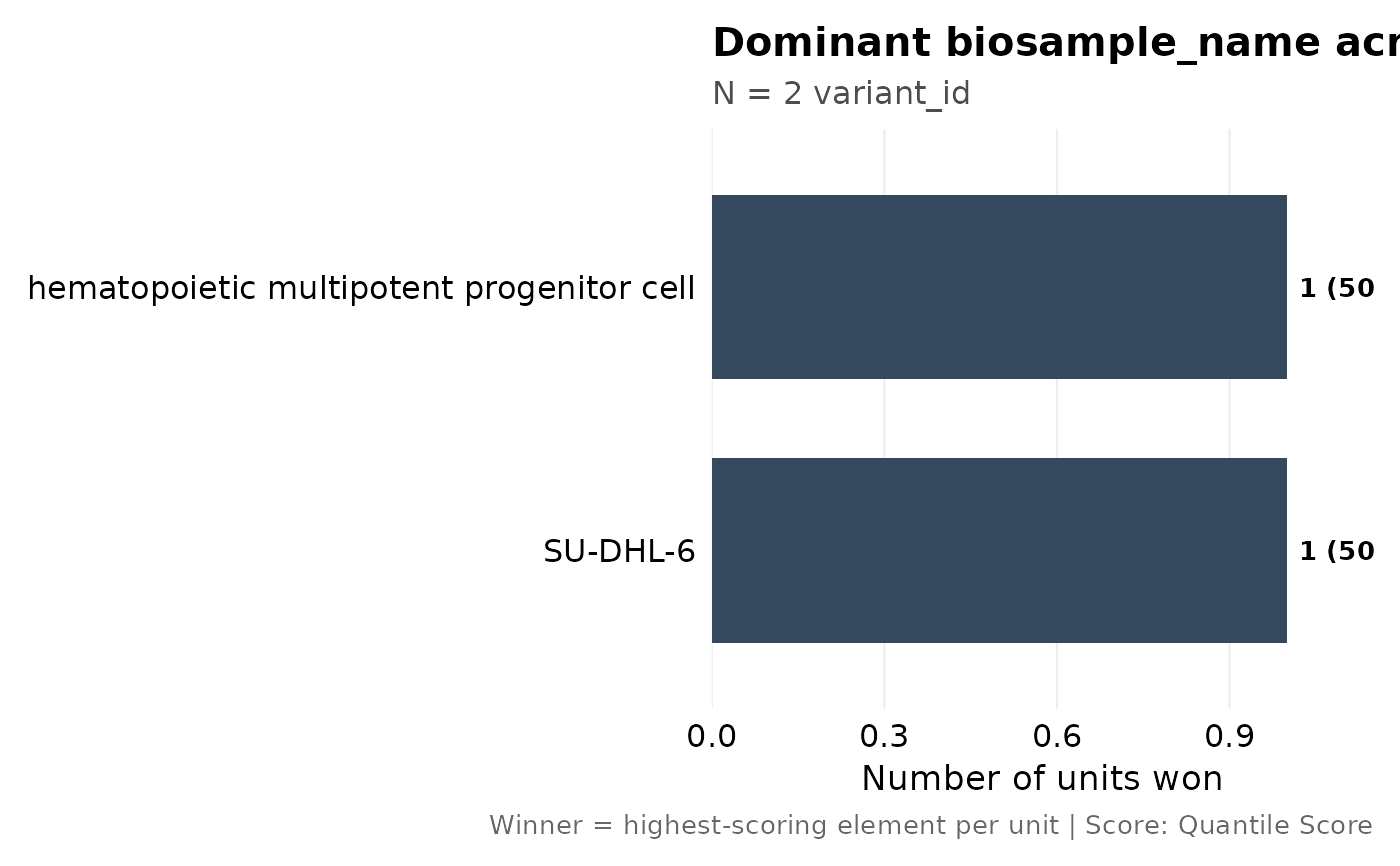
acrosselement over all units (plurality / mode): in how many units is each element the strongest? A descriptive consensus summary that complements"tau".
Arguments
- obj
An
AlphaVarSetwithobj$stats$specificity[[across]]populated.style = "impact"additionally needsobj$stats$prioritization[["variant_id"]](columnsmax_abs_score,priority_rank,is_pareto) fromav_prioritize.- style
One of
"impact"(default),"tau", or"top_element". See Description.- across
Name of the specificity variable to plot. Default
"biosample_name"(tissue); must match anacrosspassed toav_calc_specificity.- show_labels
Logical.
style = "impact"only: label the top variants bypriority_rank(default:TRUE).- label_top_n
Integer.
style = "impact"only: number of top variants to label whenshow_labels = TRUE(default:5).- point_alpha
Numeric between 0 and 1.
style = "impact"only: point transparency (default:0.75).- point_size
Numeric.
style = "impact"only: point size (default:3).- top_n
Integer. Bar styles only: number of bars to show, highest first. Truncation is reported, never silent (default:
20).- orientation
Either
"horizontal"(default, elements on the y-axis) or"vertical". Bar styles only.
Interpretation
In the impact scatter, variants in the upper-right quadrant (high impact, high specificity) have strong, element-selective regulatory effects, prime candidates for context-specific causal variants; the upper-left (high impact, low specificity) shows broad effects spread across elements. Green points (Tier 1) have direct gene-score evidence, red points (Tier 2) rely on proximity-based target-gene assignment. In the tau bars, tall bars are units whose signal is restricted to few elements. In top_element, the longest bar is the element that dominates most units; a flat profile means no single element dominates.
Examples
example_file <- system.file("extdata", "bcl11a_rs1427407_example.csv",
package = "AlphaVaR")
obj <- av_import_csv(example_file)
#> Reading bcl11a_rs1427407_example.csv ...
obj <- av_calc_specificity(obj, across = "biosample_name")
#> Warning: av_calc_specificity: dropped 4/2676 rows with NA in quantile_score, biosample_name, or variant_id.
print(obj$stats$specificity[["biosample_name"]])
#> # A tibble: 2 × 4
#> variant_id specificity n_elements top_element
#> <chr> <dbl> <int> <chr>
#> 1 chr2:60490908:T>C 0.277 496 hematopoietic multipotent progenitor…
#> 2 chr2:60490908:T>G 0.364 511 SU-DHL-6
av_plot_specificity(obj, style = "tau")
 av_plot_specificity(obj, style = "top_element")
 # The impact scatter additionally reads the prioritization table.
obj <- av_prioritize(obj)
#> Warning: av_calc_specificity: dropped 4/2676 rows with NA in quantile_score, biosample_name, or variant_id.
av_plot_specificity(obj, style = "impact", label_top_n = 2)
# The impact scatter additionally reads the prioritization table.
obj <- av_prioritize(obj)
#> Warning: av_calc_specificity: dropped 4/2676 rows with NA in quantile_score, biosample_name, or variant_id.
av_plot_specificity(obj, style = "impact", label_top_n = 2)
 # The slot is keyed by `across` alone, so a second `per` overwrites it:
# keep the (output_type, biosample_name) result in its own object.
obj_mod <- av_calc_specificity(obj, per = "output_type",
across = "biosample_name")
#> Warning: av_calc_specificity: dropped 4/2676 rows with NA in quantile_score, biosample_name, or output_type.
av_plot_specificity(obj_mod, style = "tau", across = "biosample_name")
# The slot is keyed by `across` alone, so a second `per` overwrites it:
# keep the (output_type, biosample_name) result in its own object.
obj_mod <- av_calc_specificity(obj, per = "output_type",
across = "biosample_name")
#> Warning: av_calc_specificity: dropped 4/2676 rows with NA in quantile_score, biosample_name, or output_type.
av_plot_specificity(obj_mod, style = "tau", across = "biosample_name")