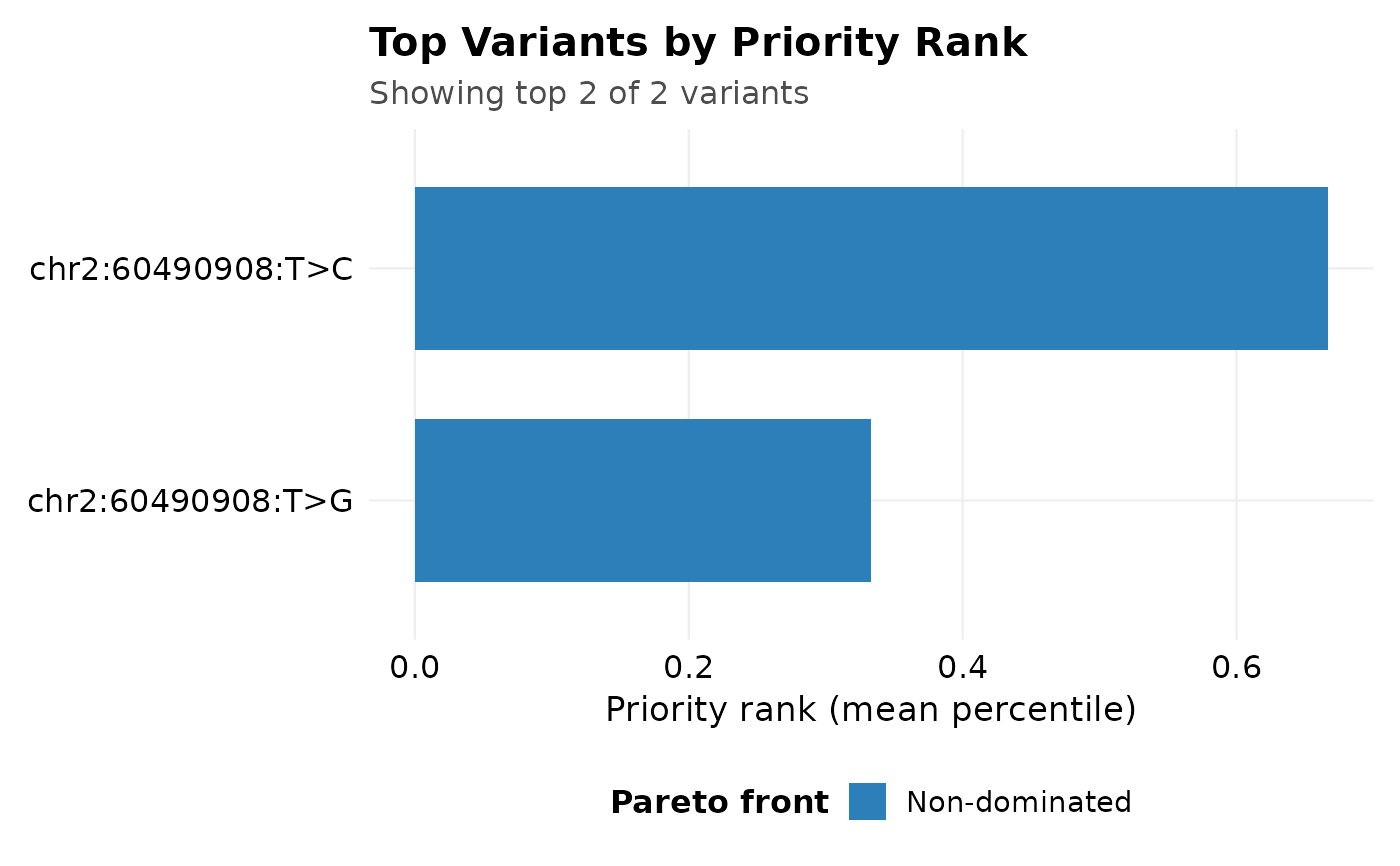
Ranked bar chart of the top variants by priority_rank, the mean
percentile across the criteria selected in av_prioritize
(strength, specificity, evidence breadth). Bars on the Pareto front (variants
not dominated on every criterion at once) are highlighted. Unlike a
calibrated score, priority_rank orders variants without claiming a
unit; the Pareto highlight marks the weight-free defensible shortlist.
Usage
av_plot_priority(
  obj,
  top_n = 20L,
  show_pareto = TRUE,
  orientation = c("horizontal", "vertical")
)
Arguments
- obj
An
AlphaVarSetobject with apriority_rankcolumn inobj$stats$prioritization[["variant_id"]].- top_n
Integer. Number of top-ranked variants to display (default:
20).- show_pareto
Logical. Highlight bars on the Pareto front (default:
TRUE).- orientation
Either
"horizontal"(default, variants on the y-axis) or"vertical"(variants on the x-axis).
Details
Requires that av_prioritize has populated
obj$stats$prioritization[["variant_id"]].
Interpretation
priority_rank is a transparent equal-weighted rank, not a calibrated score: it orders variants, it does not quantify effect. Pareto-highlighted variants are the defensible shortlist: no other variant beats them on every criterion at once. The subtitle reports how many of the total variants are shown.
Examples
example_file <- system.file("extdata", "bcl11a_rs1427407_example.csv",
                            package = "AlphaVaR")
obj <- av_import_csv(example_file)
#> Reading bcl11a_rs1427407_example.csv ...
obj <- av_prioritize(obj)
#> Warning: av_calc_specificity: dropped 4/2676 rows with NA in quantile_score, biosample_name, or variant_id.
av_plot_priority(obj)